By code coverage, we mean the action of trying to measure how much of our code has been executed by our tests.
This sound like
TL;DR Untested code is a broken code.
Definitely a strong statement but true in a way, we don’t always manage to get enough coverage.
Often this happens because we don’t have time, other times because despite having written tests we are not able to read the metrics.
So, how we can “humanize” code coverage metrics? And how we can generate its?
To answer at these questions I usually use two libraries.
to gather metrics, and
for generate human-readable reports.
How can set-up coverlet # I usually include coverlet.msbuild by MSBuild .targets Files - Visual Studio | Microsoft Docs .
 1
 2
 3
 4
 5
 6
 7
 8
 9
10
11
12
13
14
<?xml version="1.0" encoding="utf-8"?>
<Project>
<PropertyGroup>
<CollectCoverage> true</CollectCoverage>
<CoverletOutputFormat> cobertura</CoverletOutputFormat>
<CoverletOutput> $(ArtifactsCoverageDir)\$(MSBuildProjectName).xml</CoverletOutput>
</PropertyGroup>
<ItemGroup>
<PackageReference Include= "coverlet.msbuild" Version= "$(CoverletMSBuildVersion)" IsImplicitlyDefined= "true" PrivateAssets= "all" Publish= "true" />
</ItemGroup>
</Project>
For alternative ways to include coverlet into yout test project see also coverlet-coverage/coverlet: Cross platform code coverage for .NET (github.com) .
How can set-up ReportGenerator # In keeping with above to include ReportGenerator by MSBuild .targets Files - Visual Studio | Microsoft Docs .
 1
 2
 3
 4
 5
 6
 7
 8
 9
10
11
12
13
14
15
16
<?xml version="1.0" encoding="utf-8"?>
<Project>
<ItemGroup>
<PackageReference Include= "ReportGenerator" Version= "$(ReportGeneratorVersion)" IsImplicitlyDefined= "true" PrivateAssets= "all" Publish= "true" />
</ItemGroup>
<Target Name= "GenerateCoverageReport" AfterTargets= "GenerateCoverageResultAfterTest" >
<ItemGroup>
<CoverageFiles Include= "$(ArtifactsCoverageDir)\$(MSBuildProjectName).xml" />
</ItemGroup>
<ReportGenerator ProjectDirectory= "$(MSBuildProjectDirectory)" ReportFiles= "@(CoverageFiles)" TargetDirectory= "$(ArtifactsReportDir)\$(MSBuildProjectName)\Reports" ReportTypes= "Html;Latex" HistoryDirectory= "$(ArtifactsReportDir)\$(MSBuildProjectName)\History" VerbosityLevel= "Verbose" />
</Target>
</Project>
Also this tool offer a various way to use it, you can find all ways onto official documentation ReportGenerator - converts coverage reports generated by coverlet .
How to wire-up all that?# To make everything work we need to add another MSBuild file.
 1
 2
 3
 4
 5
 6
 7
 8
 9
10
11
12
<?xml version="1.0" encoding="utf-8"?>
<Project>
<PropertyGroup>
<VSTestLogger> trx</VSTestLogger>
<VSTestResultsDirectory> $(ArtifactsTestResultsDir)</VSTestResultsDirectory>
</PropertyGroup>
<Import Project= "CollectCoverage.targets" />
<Import Project= "ReportGenerator.targets" />
</Project>
And include this into your test project, something like this
1
2
3
4
5
6
7
8
9
<Project Sdk= "Microsoft.NET.Sdk" >
<PropertyGroup>
<TargetFramework> net5.0</TargetFramework>
</PropertyGroup>
<Import Project= "Tests.targets" />
</Project>
Now everything you are able to run dotnet test you will able to inspect and analyze something like this
I think that is an amazing tool to understand at a glance which codes are covered and which not.
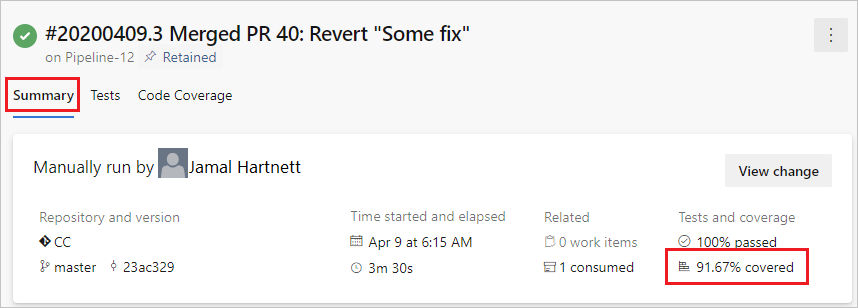
And now, how I can put it into Azure DevOps pipeline?# It would be nice if this report came was published into the Build pipeline report, don’t you think? Maybe even include branch policies for it.
Well that’s possible by use Publish Code Coverage Results task , something like this:
1
2
3
4
5
6
7
- task : PublishCodeCoverageResults@1
displayName : Publish Code Coverage Results
inputs :
codeCoverageTool : 'cobertura'
summaryFileLocation : '$(Build.SourcesDirectory)/artifacts/TestResults/$(_BuildConfig)/Reports/Summary/Cobertura.xml'
continueOnError : true
condition : always()
We notice the summaryFileLocation argument, this means that we will push only one file to Azure DevOps why?
One unwrite note of Publish Code Coverage Results task or limitation, I don’t know, is that the sum of covered lines, when we publish more reports, is take from the first file
This results in an unreliable result.
To fix that problem we can marge multiple reports into a summary reports so that can be publish it only one. One way to make it is the follow
 1
 2
 3
 4
 5
 6
 7
 8
 9
10
11
12
13
14
15
16
17
18
<?xml version="1.0" encoding="utf-8"?>
<Project Sdk= "Microsoft.NET.Sdk" DefaultTargets= "GenerateSummaryCoverageReport" xmlns= "http://schemas.microsoft.com/developer/msbuild/2003" >
<PropertyGroup>
<TargetFramework> net5.0</TargetFramework>
</PropertyGroup>
<UsingTask TaskName= "ReportGenerator" AssemblyFile= "$(NuGetPackageRoot)reportgenerator\$(ReportGeneratorVersion)\tools\$(TargetFramework)\ReportGenerator.MSBuild.dll" />
<Target Name= "GenerateSummaryCoverageReport" DependsOnTargets= "Restore" >
<ItemGroup>
<CoverageFiles Include= "$(ArtifactsCoverageDir)\*.xml" />
</ItemGroup>
<ReportGenerator ProjectDirectory= "$(MSBuildProjectDirectory)" ReportFiles= "@(CoverageFiles)" TargetDirectory= "$(ArtifactsTestResultsDir)\Reports\Summary" ReportTypes= "Cobertura" />
</Target>
</Project>
and run MSBuild project into the pipeline with
1
2
3
- script : dotnet msbuild SummaryReportGenerator.proj /p:Configuration=$(Configuration)
name : GenerateCodeCoverageSummary
displayName : Generate code coverage summary
Once you’ve done this the sum of covered lines on Build pipeline will true.
The greenfield approch.# All above is fully automated into MsBullet from version 0.6.1.
If you are approaching a greenfield then you might find this getting started useful.
If, on the other hand, you are intent on using it in a brownfield and need some tips, leave a comment below.